O QUE É R? R é uma linguagem de programação amplamente utilizada em pesquisas na área da saúde, pois fornece uma vasta coleção de pacotes de software que abrangem uma ampla gama de técnicas de análise de dados para realizar desde análises estatísticas simples até as mais complexas, para criar gráficos, figuras, sites e aplicativos.
Por ser uma linguagem de programação, ela requer a entrada de informação por meio de uma linha de comando, o que pode parecer intimidador para não programadores. No entanto, mesmo que você nunca tenha programado antes, existem várias dicas para começar e gradualmente aprender a usar o R, incluindo pacotes de software predefinidos que estendem os recursos do R básico e permitem que os usuários executem tarefas especializadas sem ter que escrever todos os códigos a partir do zero.
VANTAGENS DO R Por ser um programa de código aberto, o R facilita alterações nas análises e garante a reprodutibilidade dos resultados em novos bancos de dados, permitindo documentar e compartilhar suas análises de forma sistemática e organizada, além da possibilidade de criar relatórios reprodutíveis que combinam código, texto e visualizações em um único documento.
Para pesquisadores que não desejam usar um software estatístico comercial, o R é uma opção por ser gratuito e adaptável a diferentes sistemas operacionais.
Uma das maiores vantagens do R é o seu suporte on-line, já que conta com uma comunidade muito extensa e ativa de usuários ao redor do mundo, que continuamente desenvolvem novas funcionalidades para o programa e oferecem soluções para as diversas questões que possam surgir.
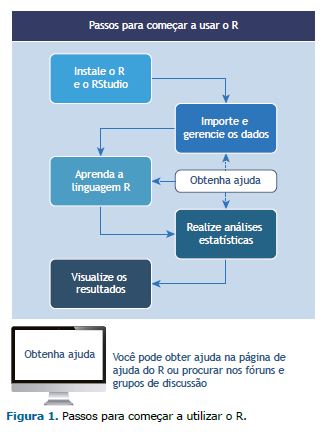
COMEÇANDO A UTILIZAR O R E O RSTUDIO Para começar a usar a programação R para análise estatística em pesquisas em saúde, você pode seguir estas etapas, resumidas na Figura 1.

- Instalando o R e o RStudio — Instale o R e o RStudio em seu computador. O R é uma linguagem de programação usada para computação estatística e gráfica, e o RStudio é um programa desenvolvido para trabalhar com a linguagem de programação R, fornecendo uma interface amigável. Visite o site oficial do R(1) e baixe a versão apropriada para o seu sistema operacional. Existe também a possibilidade de se utilizar uma versão on-line que não requer instalação de nenhum software.(2)
- Importando dados para o R — Isto envolve extrair dados de um arquivo ou de um banco de dados e importá-los para um data frame do R. Você pode importar dados para o R de várias fontes, como arquivos CSV, arquivos do Excel ou bancos de dados, e gerenciar os dados filtrando, classificando, mesclando ou transformando ban-cos de dados. Se você não possui seus próprios dados, o R tem uma lista de bancos de dados abertos que po-dem ser usados para se obter experiência prática e melhorar as habilidades de programação.
- Aprendendo noções básicas de codificação R — Familiarize-se com a linguagem básica do R. Existem vários tutori-ais on-line gratuitos, livros e recursos disponíveis para aprender R, como o “Hands-On Programming with R”(3) para iniciantes em programação. Para usar o programa R, você insere as instruções, conhecidas como coman-dos, que direcionam o R para executar uma tarefa específica, como calcular a média de uma variável ou exe-cutar um teste t para comparar dois grupos. Se você digitar um comando que o R não reconhece, ele retornará com uma mensagem de erro. Se isso acontecer, não entre em pânico! Leia a mensagem de erro para entender o problema, revise o comando que você digitou em busca de erros de digitação ou erros de sintaxe ou procure soluções on-line usando páginas de ajuda do R ou em comunidades e fóruns.
- Análise estatística — O R possui um sistema com um número variado de pacotes projetados especificamente para análise estatística, como funções básicas do R, pacote de estatísticas, pacote de análise de sobrevida e pacotes mais especializados; os pacotes não incluídos no software básico precisam ser instalados. No entanto, a análi-se estatística básica pode ser executada com alguns comandos simples e fáceis de aprender.
- Visualização de resultados — O R fornece uma gama diversificada de pacotes que permitem a geração de figuras e gráficos de alta qualidade. Os pesquisadores podem criar figuras e gráficos que facilitam uma compreensão mais profunda dos dados e auxiliam na comunicação dos principais resultados.
- Obtendo ajuda — Cada função R vem com sua própria página de ajuda que você pode acessar digitando o nome da função precedido por um ponto de interrogação. Os fóruns da comunidade R e os grupos de discussão permi-tem que você envie uma pergunta ou pesquise perguntas respondidas anteriormente. Sua participação na co-munidade o exporá a diferentes perspectivas, novas técnicas e recursos úteis.
Concluindo, aprender programação em R para análise estatística é como aprender uma nova linguagem: pode parecer um pouco difícil no começo, mas conforme você aprende, fica mais fácil. Recomendamos que, como novo usuário, você comece com pequenos projetos para desenvolver gradualmente suas habilidades e explorar técnicas avançadas à medida que avança.
AGRADECIMENTOS Muito obrigado ao Dr. Eduardo Leite Costa, que inspirou e ensinou a Dra. Ferreira a usar o R e a continua ajudando quando ela mais precisa.
REFERÊNCIAS 1. The R Foundation [homepage on the Internet]. Vienna, Austria: R Foundation for Statistical Computing; [cited 2023 Jun 17]. The R Project for Statistical Computing. Available from: https://www.r-project.org
2. posit Cloud [homepage on the Internet].Boston, MA: posit; c2023 [cited 2023 Jun 17]. Friction free data science. Available from: https://posit.cloud
3. Grolemund G. Hands-On Programming with R [monograph on the Internet]. Sebas-topol, CA: O’Reilly Media; 2014. [cited 2023 Jun 17]. Available from: https://rstudio-education.github.io/hopr/


