ABSTRACT
Objective: To derive reference values for healthy white Brazilian adults who have never smoked and to compare the obtained values with reference values derived by Crapo and by Neder. Methods: Reference equations by quantile regressions were derived in 122 men and 122 women, non-obese, living in seven cities in Brazil. Age ranged from 21 to 92 years in women and from 25 to 88 years in men. Lung function tests were performed using SensorMedics automated body plethysmographies according ATS/ERS recommendations. Lower and upper limits were derived by specific equations for 5 and 95 percentiles. The results were compared to those suggested by Crapo in 1982, and Neder in 1999. Results: Median values for total lung capacity (TLC) were influenced only by stature in men, and by stature and age in women. Residual volume was influenced by age and stature in both genders. Weight was directly related to inspiratory capacity and inversely with functional residual capacity and expiratory reserve volume in both genders. A comparison of observed TLC data with values predicted by Neder equations showed significant lower values by the present data. Mean values were similar between data from present study and those derived by Crapo. Conclusion: New predicted values for lung volumes were obtained in a sample of white Brazilians. The values differ from those derived by Neder, but are similar to those derived by Crapo.
Keywords:
Pulmonary volumes; Pulmonary function tests; Reference values; Pulmonary plethysmography
RESUMO
Objetivo: Derivar valores de referência para brasileiros adultos brancos saudáveis que nunca fumaram e comparar os valores obtidos com os valores de referência derivados por Crapo e por Neder. Métodos: Equações de referência por regressões quantílicas foram derivadas em 122 homens e 122 mulheres, não obesos, em sete cidades do Brasil. A idade variou entre 21 e 92 anos nas mulheres e de 25 a 88 anos nos homens. Os volumes pulmonares foram medidos por pletismógrafo de corpo automatizados SensorMedics, de acordo com as recomendações da SBPT e ATS/ERS. Os limites inferior e superior, expressos pelo percentil 5 e 95, foram derivados por equações específicas. Os resultados foram comparados aos sugeridos por Crapo em 1982 e Neder em 1999. Resultados: Os valores medianos para a capacidade pulmonar total (CPT) foram influenciados apenas pela estatura nos homens, e pela estatura e idade nas mulheres. O volume residual foi influenciado pela idade e estatura em ambos os sexos. O peso se correlacionou diretamente com a capacidade inspiratória e inversamente com a capacidade residual funcional e com o volume de reserva expiratório em ambos os sexos. A CPT observada, comparada com os valores previstos pela equação de Neder, foi significativamente menor. Os valores médios foram semelhantes entre os dados do presente estudo e os de Crapo. Conclusões: Novos valores previstos para os volumes pulmonares foram obtidos em uma amostra de brasileiros de raça branca. Os valores diferem daqueles derivados por Neder, mas são semelhantes aos derivados por Crapo.
Palavras-chave:
Volumes pulmonares; Testes de função pulmonar; Valores de referência; Pletismografia pulmonar.
INTRODUÇÃOAs medidas dos volumes pulmonares estáticos na prática se referem à mensuração das várias capacidades e volumes pulmonares. As capacidades incluem: Capacidade residual funcional (CRF) - o volume de ar presente no pulmão ao final da expiração em volume corrente; Capacidade pulmonar total (CPT) - volume total de ar nos pulmões ao final de uma inspiração máxima; Capacidade vital (CV) - volume de ar totalmente expirado após inspiração máxima ou inspirado após expiração máxima; Capacidade inspiratória (CI) - volume de ar inspirado a partir do final de uma expiração normal. (1) Estas quatro capacidades podem ser divididas em volumes, tendo particular interesse o volume de reserva expiratória (VRE), o volume máximo de gás que pode ser exalado a partir da CRF e o volume residual (VR) que é o volume de gás que permanece nos pulmões após expiração máxima.(1)
A medida dos volumes pulmonares tem diversas aplicações clínicas. Redução da CPT estabelece a presença de restrição. Aparente restrição na espirometria (redução da CVF e VEF1, com relação VEF1/CVF na faixa prevista) em muitos casos não é confirmada por CPT reduzida. Esta combinação é denominada distúrbio inespecífico e é comumente observado em doenças obstrutivas com fechamento de vias aéreas, na obesidade e doenças neuromusculares.(2) Em pacientes com CPT reduzida, uma CVF desproporcionalmente reduzida, (CPT%-CVF% previsto>10%), denominada recentemente como "padrão restritivo complexo", aponta para entidades clínicas que resultam em esvaziamento pulmonar prejudicado, tais como doenças neuromusculares, obstrução oculta e doenças da parede torácica. (3) Volumes pulmonares elevados, particularmente elevação do VR e da relação VR/CPT, são comuns na limitação ao fluxo aéreo, podendo ser o único achado anormal.(4,5) O aprisionamento de ar é importante na avaliação de gravidade das doenças obstrutivas e na resposta ao tratamento. Em muitos casos, a redução do VR é observada em grau maior do que as mudanças observadas na espirometria.(6) CRF reduzida às custas de redução do VRE é uma característica da obesidade. (7) Aumento do VRE em obesos se correlaciona com redução da dispneia após cirurgia bariátrica.(8) A CRF aumenta com o grau de obstrução ao fluxo aéreo, o que resulta em queda da CI. Relação CI/CPT <25% prediz maior mortalidade em DPOC.(9)
Os valores de referência para os volumes pulmonares estáticos mostram notáveis diferenças entre diferentes autores.(10) Estas diferenças podem se dever a vários fatores, como seleção dos indivíduos, diferenças metodológicas e técnicas, inclusão de diferentes grupos étnicos e tipos de equação utilizados para cálculo dos valores previstos. Na seleção da amostra, idealmente mais de 100 adultos de cada sexo para cada grupo étnico, com uma frequência de distribuição semelhante nas diversas faixas de idade devem ser incluídos.(10)
Muitos estudos sobre valores de referência são antigos, com inclusão de amostras pequenas.(11) No Brasil, valores de referência para os volumes pulmonares foram derivados por Neder et al.(12) em 1999 em 50 homens e 50 mulheres de raças diversas e são usados em alguns centros. No Brasil, a equação de Crapo é também utilizada como referência para os volumes pulmonares, mas sua adequação à nossa população nunca foi testada.(2,13)
O objetivo do presente estudo foi determinar valores de referência para os volumes pulmonares em uma amostra multicêntrica brasileira da raça branca e comparar aos resultados obtidos pelas equações de Neder e de Crapo.
MÉTODOSOs dados foram obtidos em sete cidades brasileiras por pletismógrafos de corpo automatizados da mesma marca (SensorMedics, Yorba Linda, California) entre 2015 e 2017 (Centro Diagnóstico Brasil, São Paulo; Clínica AMO, Salvador; Hospital Madre Teresa, Belo Horizonte; Clínica Matos, Criciúma; e outros). Os indivíduos foram selecionados por convite verbal, sendo mais comumente acompanhantes ou familiares de pacientes ou funcionários das instituições do estudo. Os voluntários que aceitaram e consentiram em participar do estudo responderam inicialmente a um questionário respiratório traduzido da American Thoracic Society/Division of Lung Diseases, validado em nosso meio e, preenchidos os critérios de inclusão, assinaram o termo de consentimento livre e esclarecido.(14,15)
O projeto foi aprovado pelo Comitê de Ética e Pesquisa do Hospital Madre Teresa/Belo Horizonte, Minas Gerais, sob o número 1617108. O projeto não foi submetido para aprovação em todos os centros, no entanto a documentação completa de todos os centros envolvidos foi adicionada ao projeto aprovado.
Os critérios de inclusão do estudo foram:
- Idade acima de 20 anos no sexo feminino e 25 anos no sexo masculino;(16)
- Índice de Massa Corpórea (IMC) entre 18 e 30 kg/m2;
- Ausência de sintomas respiratórios significativos, doenças respiratórias atuais ou prévias, doenças cardía-cas, cirurgia torácica prévia e exposição ocupacional relevante;(15)
- Não ter fumado durante toda a vida. Mulheres que cozinharam em fogão a lenha, bem como pessoas ex-postas à fumaça de cigarro no quarto de dormir, foram excluídas;
- Cor autodeclarada como branca pelo indivíduo e confirmada pelos observadores.
- Os exames foram realizados por técnicos ou médicos certificados em função pulmonar pela SBPT.
Os testes espirométricos seguiram as normas sugeridas pela Sociedade Brasileira de Pneumologia e Tisiologia (SBPT) e pelas diretrizes da ATS/ERS.(1,17) Os volumes foram medidos em pletismógrafos SensorMedics de pressão variável equipados com um pneumotacógrafo de acordo com as normas propostas pela American Thoracic Society e European Respiratory Society.(18) O sinal de volume foi calibrado com uma seringa de 3,0 L conectada ao pneumotacógrafo de acordo com as recomendações do fabricante, diariamente antes do início dos trabalhos. O transdutor de pressão de boca e as pressões e fluxos no pletismógrafo foram calibrados diariamente. Os parâmetros funcionais foram expressos em BTPS.(17)
Os procedimentos foram conduzidos na posição sentada com os indivíduos fazendo uso de grampo nasal. Após instruções detalhadas a respeito do teste, a porta do pletismógrafo foi fechada e o tempo para equilíbrio de temperatura aguardado.
O paciente foi então orientado a colocar a peça bucal e respirar calmamente até que um platô no nível endoexpiratório fosse atingido. Quando a respiração se encontrava ao nível da CRF, o obturador era fechado e o paciente instruído a arfar suavemente, em uma frequência entre 0,5 e 1,0 Hz. Os desenhos de pressão-fluxo foram registrados para cálculo da resistência das vias aéreas (não incluídas no presente estudo). Os gráficos de pressão-volume para determinação da CRF foram obtidos por meio do fechamento do obturador ao final de uma expiração normal. Após a abertura do obturador, o VRE e a capacidade vital inspiratória foram determinados. O VR foi obtido pela subtração do VRE da CRF, e a CPT foi computada como a soma do VR e da CV. A capacidade inspiratória foi calculada pela CPT-CRF. Destes dados, a relação VR/CPT (%) foi calculada. O sistema registra quatro alças por manobra, e pelo menos três manobras foram realizadas em todos os testados, portanto, com 12 alças. Não preenchidos os critérios de aceitação, mais alças foram realizadas. Pelo menos três manobras com variabilidade da CRF ≤5% em torno do valor médio e capacidade vital ≤0,15 L foram obtidas. O valor final anotado foi o valor médio. Todas as curvas obtidas nos exames individuais foram enviadas e reanalisadas por um dos autores (CACP).
Foram excluídos testes de 46 casos (16%) que não preencheram os critérios de aceitação das curvas para inclusão. Os dados destes indivíduos não foram comparados aos incluídos.
Inicialmente, as variáveis de natureza numérica foram analisadas descritivamente, sendo apresentadas as medidas-resumo na forma de mediana e quartis (1° quartil, 3° quartil) e os níveis dessas variáveis foram comparados por sexo, utilizando-se o teste não paramétrico de Mann-Whitney.
Regressões quantílicas foram usadas para derivação dos valores de referência.(19) As regressões quantílicas foram ajustadas (mediana, percentis 5 e 95) tendo, como variáveis dependentes, cada uma das variáveis funcionais e, como variáveis preditoras, a idade, estatura e peso, bem como termos quadráticos para a idade e estatura. Inicialmente, todas as variáveis preditoras foram incluídas no modelo. Em seguida, as variáveis não significantes a 5% foram excluídas uma a uma por ordem de significância (método retrógrado).
Os valores espirométricos foram comparados aos previstos para a população brasileira.(20)
Diferenças entre os valores medianos observados e os médios previstos para a CPT, CV, VR e VR/CPT pelas equações de Neder et al.(12) e Crapo et al.(13) foram calculadas e a significância da diferença calculada por teste de t de uma amostra em ambos os sexos. As diferenças da CPT entre os valores previstos por Crapo e Neder e os observados na presente amostra foram desenhadas por gráficos e as diferenças calculadas por teste de t emparelhado.(21)
Como sugerido recentemente, para se aproximar de magnitude de efeito relevante em estudos observacionais e pela multiplicidade de comparações, o valor de p significativo foi considerado < 0,005, na comparação entre os valores encontrados no presente estudo e os calculados por Neder e Crapo.(22)
As análises estatísticas foram realizadas com o uso dos softwares estatísticos Stata 12 e SPSS-22.
RESULTADOS
Foram incluídos no estudo 244 indivíduos (122 de cada sexo). Os indivíduos foram testados, por ordem decrescente, em São Paulo (62%), Salvador (13%), Criciúma (10%), Belo Horizonte (7%) e outros locais (8%).
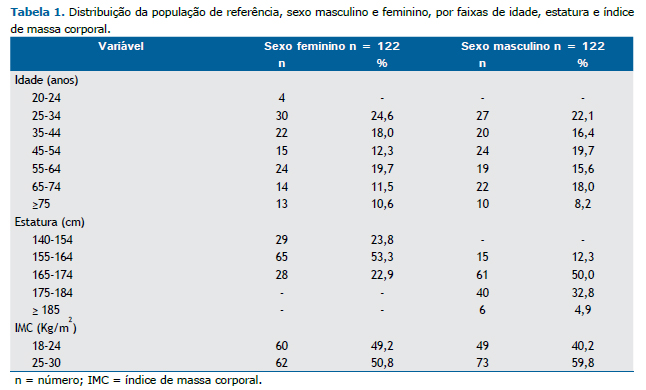
A distribuição para os dados antropométricos é mostrada na Tabela 1. A idade no sexo masculino variou de 25-88 anos e de 21 a 92 anos no sexo feminino. A mediana de estatura no sexo masculino foi de 173 cm (156-189 cm) e 160 cm (140-174 cm) no sexo feminino.
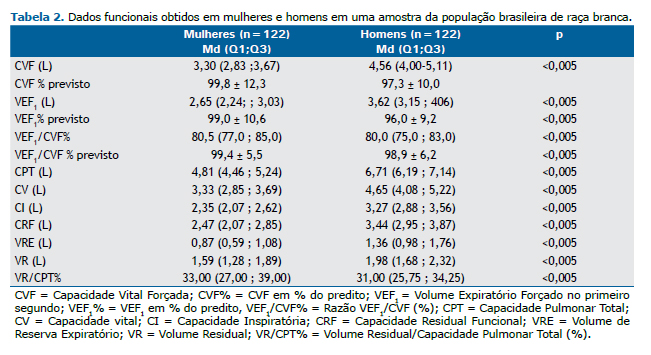
Os valores medianos e a dispersão para os dados funcionais principais, expressos pelos quartis 1 e 3, são mostrados na Tabela 2.
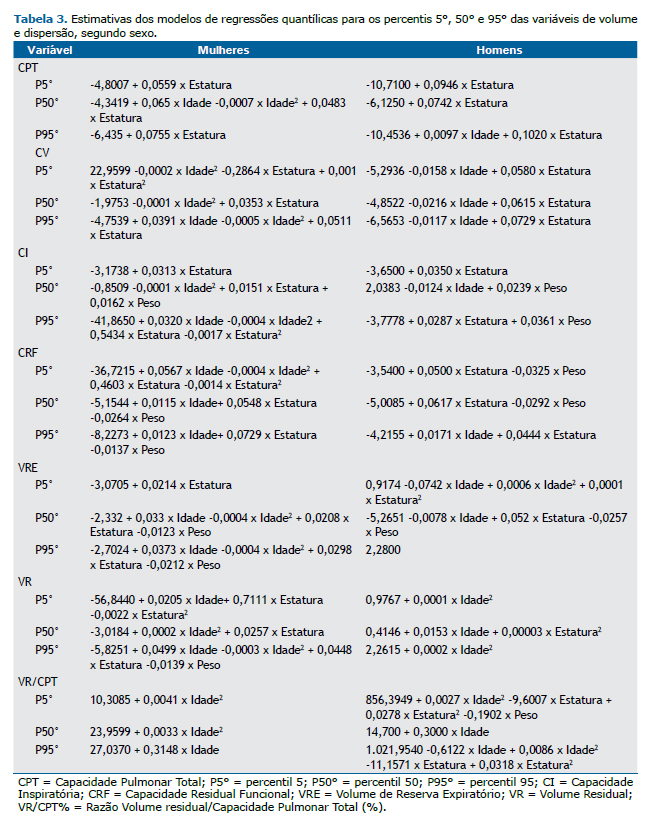
A Tabela 3 apresenta as estimativas dos modelos finais.
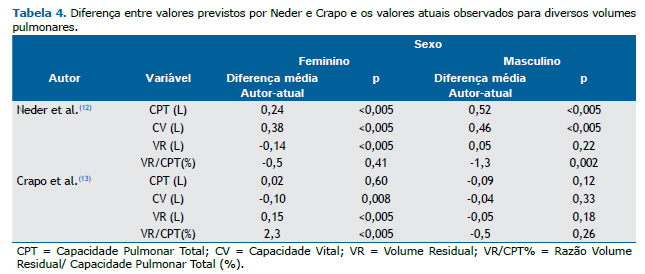
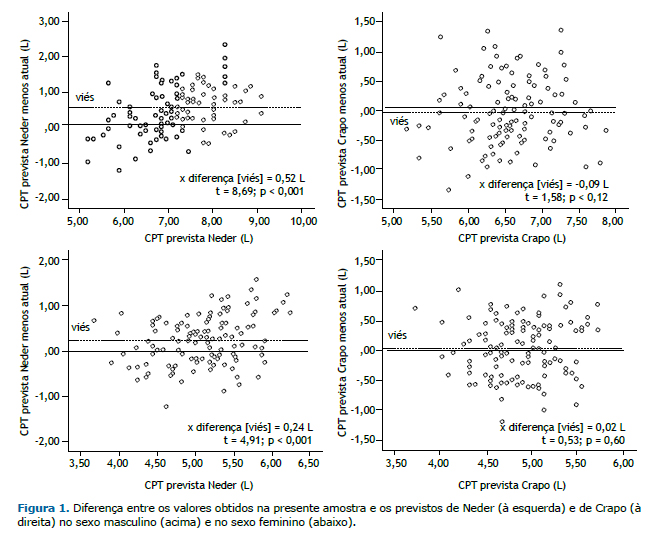
As comparações entre os valores observados para a CPT e os previstos pelas equações de Crapo e Neder são mostradas na Tabela 4 e Figura 1. Os valores previstos por Neder foram superiores aos encontrados no presente estudo. Para o sexo masculino, a média da diferença foi de 0,48 L e, para o sexo feminino, 0,31 L (p<0,001, para ambos). As diferenças médias entre os valores previstos por Crapo e os encontrados no presente estudo para a CPT foram pequenas e não significantes: no sexo masculino, 0,12 L a mais pelos dados do presente estudo e, para o sexo feminino, 0,10 L a menos.
DISCUSSÃO
O presente estudo derivou por pletismografia novos valores previstos para os volumes pulmonares para indivíduos adultos que nunca fumaram, de raça branca, no Brasil.
A medida da CPT é essencial para o diagnóstico da presença de distúrbio restritivo. A CV pode estar reduzida em ambos, distúrbio restritivo e obstrutivo, no último, por aumento do volume residual. CPT elevada indica, em geral, perda da retração elástica dos pulmões, como ocorre no enfisema e em alguns casos de asma.(23) Além disso, a medida dos volumes pulmonares é essencial para interpretação de outros parâmetros funcionais, tais como a resistência das vias aéreas, que varia inversamente com o volume pulmonar.
Os fatores que determinam o tamanho normal dos pulmões incluem estatura, idade, sexo, massa corporal, altitude, grupo étnico e padrão de atividade física.(24-26) O nível de inspiração máxima (CPT) é influenciado pela força desenvolvida pelos músculos inspiratórios, retração elástica dos pulmões e as propriedades elásticas do tórax e estruturas adjacentes. Grandes nadadores, mergulhadores e praticantes de remo podem ter aumento da CPT, pelo aumento da força muscular.(27)
Considera-se que os valores previstos para a CPT são independentes da idade porque a redução na retração elástica pulmonar é compensada pelos efeitos combinados de perda da força muscular e aumento da rigidez da caixa torácica com o avançar da idade.(27) Isto negligencia o fato de que a gordura corporal, a qual, em média, aumenta com a idade, pode reduzir o volume pulmonar.(27) No presente estudo, apenas a estatura isoladamente influenciou a CPT nos homens; nas mulheres, o efeito da idade foi significante, porém com efeitos opostos, como observado por outros.(28) As mulheres têm maior tendência a ganhar peso com a idade e os homens maior tendência a perder retração elástica.(27) Em alguns estudos, a idade influenciou a CPT em homens e mulheres, em outros, apenas nas mulheres.(12,13,28,29)
O volume de gás no final de uma expiração plena reflete um balanço entre a força dos músculos acessórios da expiração, a compressibilidade inerente da caixa torácica e o fechamento das vias aéreas.(26) Em adultos, o fator limitante do VR se torna a retração elástica diminuída; isto leva ao estreitamento e eventual fechamento das vias aéreas. Com o avanço da idade, a retração elástica pulmonar cai. Como resultado, o VR e a relação VR/CPT aumentam com a idade. Além da perda da retração elástica, o acúmulo de gordura e a queda da força dos músculos respiratórios levam à redução da CV, a qual, portanto, é multifatorial.
A gordura constitui um componente importante do índice de massa corporal, mas este índice também inclui a massa livre de gordura, da qual o maior componente é muscular. No presente estudo, a CI se correlacionou diretamente com o peso, o que pode ser explicado pela correlação da massa muscular com o peso, e a CRF e o VRE se correlacionaram negativamente com o peso, provavelmente por efeito da deposição de maior gordura central, mesmo com a inclusão no estudo de indivíduos com IMC na faixa normal. Metade das mulheres e 65% dos homens no presente estudo tinham valores de IMC acima de 25, indicando sobrepeso.
Os valores derivados no presente estudo foram comparados aos valores sugeridos por Neder e Crapo. (12,13) Crapo et al.(13) avaliaram 122 indivíduos do sexo feminino e 123 do sexo masculino em Salt Lake City (altitude 1400m), todos mórmons.(13) O método de seleção não foi descrito. Os volumes pulmonares podem ser maiores em habitantes nascidos em locais com mais de 1800 m de altitude, presumivelmente por maior crescimento pulmonar pela hipoxemia. (27) Portanto, este fator não deve ter influenciado os valores observados no presente estudo e no de Crapo et al.(13). Apenas dois indivíduos, do sexo masculino, tinham idade acima de 85 anos. A técnica utilizada foi a de respiração única por diluição de hélio, usada na medida da difusão do CO, o que pode subestimar a CPT. (30) As equações foram derivadas por regressão linear.
Como a CPT pode variar para mais ou para menos nas doenças respiratórias, testes bicaudais (2x EPE) foram usados por Crapo para estabelecer os limites de referência, o que resultou em ampla variação em torno do valor previsto. Os limites da CPT seriam calculados somando-se ou se subtraindo 1,08 L aos previstos no sexo feminino e 1,61 L no sexo masculino. Entretanto, doenças pulmonares comuns apresentam tendência ou para aumento ou para diminuição da CPT, e o cálculo dos limites pelos percentis 5 e 95 é aceito. (28) Calculando-se os limites de 5% para a CPT no sexo masculino pelas equações de Crapo (previsto-1,30), o limite inferior seria de 80% do valor médio em comparação a 84% da mediana prevista pela equação atual. No sexo feminino, estes valores seriam de 82% pela equação de Crapo e 86% pela equação atual. Portanto, no presente estudo, os limites inferiores são mais próximos do valor previsto, aumentando a sensibilidade para detecção de distúrbio restritivo.
Neder et al.(12) derivaram valores de referência em 50 indivíduos de cada sexo, de 20-80 anos, selecionados ao acaso entre funcionários de um grande hospital em São Paulo. O perfil racial foi variável, com inclusão de 34 indivíduos de raça não branca. A raça tem um efeito significativo sobre os volumes pulmonares. (31) Obesos não foram excluídos. O método utilizado para determinação da CRF foi o de lavagem do N2 por respirações múltiplas. Os testes foram realizados em um sistema Medical Graphics, sistema que fornece resultados maiores em comparação a outros sistemas de grande porte, o que pode explicar os elevados valores encontrados.(32)
O padrão de atividade física e a composição corporal foram determinados e influenciaram os volumes pulmonares na análise univariada, mas não na multivariada.
Os valores foram derivados por equações lineares. Como mostrado na Tabela 4 e Figura 1, os valores de Neder et al.(12) superestimam de modo relevante os valores para a CPT e para a CV, quando comparados ao presente estudo.
Regressões quantílicas foram utilizadas no presente estudo, como em outros estudos, sobre valores de referência para a função pulmonar.(33) No método linear clássico, por determinação da reta de mínimos quadrados, considera-se que a dispersão dos valores de y em torno da reta de regressão (resíduos) tenha distribuição normal, e que o mesmo erro ocorre para diferentes valores de x. Entretanto, as covariáveis podem influenciar a distribuição dos resíduos de diversas maneiras. Uma vantagem de usar a regressão quantílica para estimar a mediana, em vez da regressão de mínimos quadrados habitual para estimar a média, é que o resultado da regressão quantílica é mais robusto, em resposta aos outliers.(19,34)
A comparação entre a atual equação e a de Crapo et al.(13) e Neder et al.(12) deve levar em conta que diferentes modelos de regressão foram utilizados, porém as diferenças não podem ser explicadas pelo modelo estatístico. Dados adicionais que devem ser considerados são o tipo de equipamento e os métodos utilizados, além dos critérios de seleção e o tamanho das amostras. Reavaliação cuidadosa dos critérios de aceitação das manobras foi aplicada no presente estudo por revisão de todos os casos.
O presente estudo apresenta limitações. A mais óbvia é a incerteza da extensão dos dados para a raça negra, importante no Brasil. O nível de atividade física dos participantes não foi avaliado. No presente estudo, voluntários foram convidados. Para a derivação de valores de referência para a função pulmonar, devem ser incluídos apenas indivíduos não fumantes e sem sintomas ou doenças cardiorrespiratórias. Para isto, um questionário epidemiológico respiratório validado deve ser aplicado. Preenchidas as condições referidas, o uso de voluntários para estabelecimento de valores de referência é válido.(10,14) Metodologia muito semelhante ao presente estudo foi aplicada em diversos centros no Canadá, em voluntários, para obtenção de valores de referência para a função pulmonar, incluindo medida de volumes pulmonares.(35)
Em resumo, o presente estudo derivou novos valores de referência para os volumes pulmonares por pletismografia em indivíduos de raça branca no Brasil. Os valores diferem dos previstos sugeridos por Neder e são próximos aos derivados por Crapo.
REFERÊNCIAS
1. Pereira CAC, Neder JA. Diretrizes para testes de função pulmonar. J Bras Pneumol. 2002;28(Supl 3):1-238.
2. Schultz K, D'Aquino LC, Soares MR, Gimenez A, Pereira CA. Lung volumes and airway resistance in patients with a possible restrictive pattern on spirometry. J Bras Pneumol. 2016;42(5):341-7. http://dx.doi.org/10.1590/S1806-37562016000000091. PMid:27812633.
3. Clay RD, Iyer VN, Reddy DR, Siontis B, Scanlon PD. The "complex restrictive" pulmonary function pattern: clinical and radiologic analysis of a common but previously undescribed restrictive pattern. Chest. 2017;152(6):1258-65. http://dx.doi.org/10.1016/j.chest.2017.07.009. PMid:28728932.
4. Elbehairy AF, Parraga G, Webb KA, Neder JA, O'Donnell DE. Mild chronic obstructive pulmonary disease: why spirometry is not sufficient! Expert Rev Respir Med. 2017;11(7):549-63. http://dx.doi.org/10.1080/17476348.2017.1334553. PMid:28548545.
5. Vulterini S, Bianco MR, Pellicciotti L, Sidoti AM. Lung mechanics in subjects showing increased residual volume without bronchial obstruction. Thorax. 1980;35(6):461-6. http://dx.doi.org/10.1136/thx.35.6.461. PMid:7434303.
6. Newton MF, O'Donnell DE, Forkert L. Response of lung volumes to inhaled salbutamol in a large population of patients with severe hyperinflation. Chest. 2002;121(4):1042-50. http://dx.doi.org/10.1378/chest.121.4.1042. PMid:11948031.
7. Jones RL, Nzekwu MM. The effects of body mass index on lung volumes. Chest. 2006;130(3):827-33. http://dx.doi.org/10.1378/chest.130.3.827. PMid:16963682.
8. Boissière L, Perotin-Collard JM, Bertin E, Gaubil I, Diaz Cives A, Barbe C, et al. Improvement of dyspnea after bariatric surgery is associated with increased Expiratory Reserve Volume: a prospective follow-up study of 45 patients. PLoS One. 2017;12(9):e0185058. http://dx.doi.org/10.1371/journal.pone.0185058. PMid:28931052.
9. Casanova C, Cote C, de Torres JP, Aguirre-Jaime A, Marin JM, Pinto-Plata V, et al. Inspiratory-to-total lung capacity ratio predicts mortality in patients with chronic obstructive pulmonary disease. Am J Respir Crit Care Med. 2005;171(6):591-7. http://dx.doi.org/10.1164/rccm.200407-867OC. PMid:15591470.
10. Stocks J, Quanjer PH. Reference values for residual volume, functional residual capacity and total lung capacity. Eur Respir J. 1995;8(3):492-506. http://dx.doi.org/10.1183/09031936.95.08030492. PMid:7789503.
11. Goldman HI, Becklake MR. Respiratory function tests: normal values at median altitude and the prediction of normal results. Am Rev Tuberc. 1959;79(4):457-67. PMid:13650117.
12. Neder JA, Andreoni S, Castelo-Filho A, Nery LE. Reference values for lung function tests. I. Static volumes. Braz J Med Biol Res. 1999;32(6):703-17. http://dx.doi.org/10.1590/S0100-879X1999000600006. PMid:10412549.
13. Crapo RO, Morris AH, Clayton PD, Nixon CR. Lung volumes in healthy nonsmoking adults. Bull Eur Physiopathol Respir. 1982;18(3):419-25. PMid:7074238.
14. Ferris BG. Epidemiology standardization project: III. Recommended standardized procedures for pulmonary function testing. Am Rev Respir Dis. 1978;118(6 Pt 2):55-88. PMid:742764.
15. Aguiar VAN, Beppu OS, Romaldini H, Ratto OR, Nakatani J. Validade de um questionários respiratório modificado (ATS-DLD-78) como instrumento de um estudo epidemiológico em nosso meio. J Pneumol. 1988;14(3):111-6.
16. Burrows B, Cline MG, Knudson RJ, Taussig LM, Lehowitz MD. A descriptive analyses of the growth and decline of the FVC and FEV. Chest. 1983;83(5):717-24. http://dx.doi.org/10.1378/chest.83.5.717. PMid:6839813.
17. Miller MR, Hankinson J, Brusasco V, Burgos F, Casaburi R, Coates A, et al. Standardisation of spirometry. Eur Respir J. 2005;26(2):319-38. http://dx.doi.org/10.1183/09031936.05.00034805. PMid:16055882.
18. Wanger J, Clausen JL, Coates A, Pedersen OF, Brusasco V, Burgos F, et al. Standardisation of the measurement of lung volumes. Eur Respir J. 2005;26(3):511-22. http://dx.doi.org/10.1183/09031936.05.00035005. PMid:16135736.
19. Koenker R. Quantile regression. New York: Cambridge University Press; 2005. http://dx.doi.org/10.1017/CBO9780511754098.
20. Pereira CA, Sato T, Rodrigues SC. Novos valores de referência para espirometria forçada em brasileiros adultos de raça branca. J Bras Pneumol. 2007;33(4):397-406. http://dx.doi.org/10.1590/S1806-37132007000400008. PMid:17982531.
21. Marsh S, Aldington S, Williams M, Weatherall M, Shirtcliffe P, McNaughton A, et al. Complete reference ranges for pulmonary function tests from a single New Zealand population. N Z Med J. 2006;119(1244):U2281. PMid:17072356.
22. Ioannidis JPA. The proposal to lower P value thresholds to. 005. JAMA. 2018;319(14):1429-30. http://dx.doi.org/10.1001/jama.2018.1536. PMid:29566133.
23. Gelb AF, Licuanan J, Shinar CM, Zamel N. Unsuspected loss of lung elastic recoil in chronic persistent asthma. Chest. 2002;121(3):715-21. http://dx.doi.org/10.1378/chest.121.3.715. PMid:11888951.
24. Quanjer PH, Tammeling GJ, Cotes JE, Pedersen OF, Peslin R, Yernault JC. Lung volumes and forced ventilatory flows. Eur Respir J Suppl. 1993;6(Supl 16):5-40. http://dx.doi.org/10.1183/09041950.005s1693. PMid:8499054.
25. Cotes JE, Chinn DJ, Miller MR, editores. Lung function. 6th ed. Malden: Blackwell Publishing; 2006. Lung volumes; p. 111-7. http://dx.doi.org/10.1002/9781444312829.ch10.
26. Bancalari E, Clausen J. Pathophysiology of changes in absolute lung volumes. Eur Respir J. 1998;12(1):248-58. http://dx.doi.org/10.1183/09031936.98.12010248. PMid:9701447.
27. Cotes JE, Chinn DJ, Miller MR, editores. Lung function. 6th ed. Malden: Blackwell Publishing; 2006. Normal lung function from childhood to old age; p. 317-32.
28. Koch B, Friedrich N, Völzke H, Jörres RA, Felix SB, Ewert R, et al. Static lung volumes and airway resistance reference values in healthy adults. Respirology. 2013;18(1):170-8. http://dx.doi.org/10.1111/j.1440-1843.2012.02268.x. PMid:23279785.
29. Gutierrez C, Ghezzo RH, Abboud RT, Cosio MG, Dill JR, Martin RR, et al. Reference values of pulmonary function tests for Canadian Caucasians. Can Respir J. 2004;11(6):414-24. http://dx.doi.org/10.1155/2004/857476. PMid:15510249.
30. Hughes JM, Pride NB. Examination of the carbon monoxide diffusing capacity (DL(CO)) in relation to its KCO and VA components. Am J Respir Crit Care Med. 2012;186(2):132-9. http://dx.doi.org/10.1164/rccm.201112-2160CI. PMid:22538804.
31. Cotes JE, Chinn DJ, Miller MR, editores. Lung function. 6th ed. Malden: Blackwell Publishing; 2006. Genetic diversity: reference values in non-caucasians; p. 366-81. http://dx.doi.org/10.1002/9781444312829.ch27.
32. Jensen RL, Teeter JG, England RD, White HJ, Pickering EH, Crapo RO. Instrument accuracy and reproducibility in measurements of pulmonary function. Chest. 2007;132(2):388-95. http://dx.doi.org/10.1378/chest.06-1998. PMid:17573502.
33. Koch B, Schäper C, Ewert R, Völzke H, Obst A, Friedrich N, et al. Lung function reference values in different German populations. Respir Med. 2011;105(3):352-62. http://dx.doi.org/10.1016/j.rmed.2010.10.014. PMid:21130637.
34. Gannoun A, Girard S, Guinot C, Saracco J. Reference curves based on non-parametric quantile regression. Stat Med. 2002;21(20):3119-35. http://dx.doi.org/10.1002/sim.1226. PMid:12369086.
35. Gutierrez C, Ghezzo RH, Abboud RT, Cosio MG, Dill JR, Martin RR, et al. Reference values of pulmonary function tests for Canadian Caucasians. Can Respir J. 2004;11(6):414-24. http://dx.doi.org/10.1155/2004/857476. PMid:15510249.


