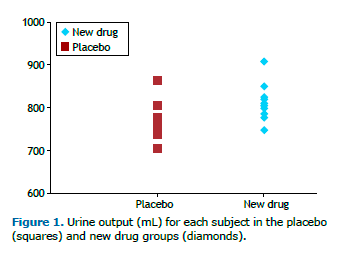
WHY CALCULATE A P VALUE?Consider an experiment in which 10 subjects receive a placebo, and another 10 receive an experimental diuretic. After 8 h, the average urine output in the placebo group is 769 mL, versus 814 mL in the diuretic group-a difference of 45 mL (Figure 1). How do we know if that difference means the drug works and is not just a result of chance?

The most common way to approach this problem is to use statistical hypothesis testing. First, we state the null hypothesis of no statistical dif-ference between the groups and the alternative hypothesis of a statistical difference. Then we select a statistical test to compute a test statistic, which is a standardized numerical measure of the between-group difference. Under the null hypothesis, we expect the test statistic value to be small, but there is a small probability that it is large, just by chance. Once we calculate the test statistic, we use it to calculate the p-value.
The p value is defined as the probability of observing the given value of the test statistic, or greater, under the null hypothesis. Traditionally, the cut-off value to reject the null hypothesis is 0.05, which means that when no difference exists, such an extreme value for the test statistic is expected less than 5% of the time.
Now let us go back to our case: we are comparing means and assuming that the data is normally distributed, so we use a t-test and compute a t-statistic of 2.34, with a p value of 0.031. Because we use a 0.05 cutoff for the p value, we reject the null hypothesis and conclude that there is a statistically significant difference between groups. So what does "p = 0.031" mean? It means that there is only a 3% probability of observing a difference of 45 mL in the average urine output between groups under the null hypothesis. Because this is a very small probability, we reject the null hypothesis. It does not mean that the drug is a diuretic, nor that there is 97% chance of the drug being a diuretic.
MISCONCEPTIONS ABOUT THE P VALUE
Clinical versus statistical significance of the effect sizeThere is a misconception that a very small p value means the difference between groups is highly relevant. Looking at the p value alone devi-ates our attention from the effect size. In our example, the p value is significant but a drug that increases urine output by 45 mL has no clinical relevance.
Nonsignificant p valuesAnother misconception is that if the p value is greater than 5%, the new treatment has no effect. The p value indicates the probability of ob-serving a difference as large or larger than what was observed, under the null hypothesis. But if the new treatment has an effect of smaller size, a study with a small sample may be underpowered to detect it.
Overinterpreting a nonsignificant p value that is close to 5%Yet another misconception is that if the p value is close to 5%, there is a trend towards a group difference. It is inappropriate to interpret a p value of, say, 0.06, as a trend towards a difference. A p value of 0.06 means that there is a probability of 6% of obtaining that result by chance when the treatment has no real effect. Because we set the significance level at 5%, the null hypothesis should not be rejected.
Effect sizes versus p valuesMany researchers believe that the p value is the most important number to report. However, we should focus on the effect size. Avoid reporting the p value alone and preferably report the mean values for each group, the difference, and the 95% confidence interval-then the p value.
RECOMMENDED LITERATURE1. Glantz SA. Primer in Biostatistics, 5th ed. New York: McGraw-Hill; 2002.


